OK.Wahl
Internetpräsentation
Version 2.2.7
Ergebnis zur Landtagswahl 2013 am 15.09.2013
Stimmkreis Erlangen-Stadt
Es wurden alle Stimmbezirke ausgewertet.
 Diagramm
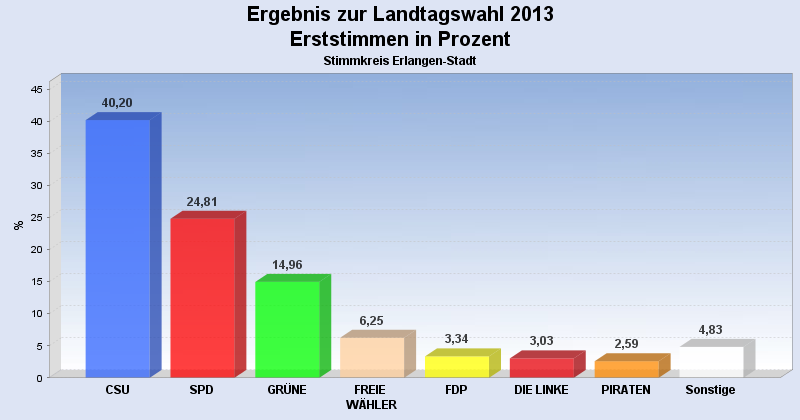
 Seitenanfang
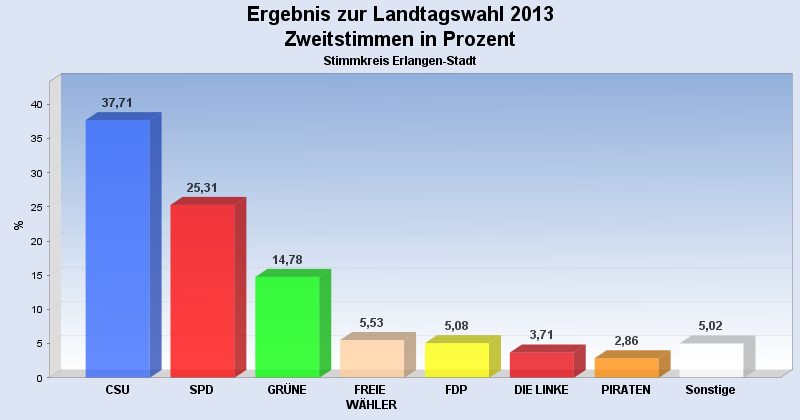
Wahlbeteiligung, Stimmzettel, Stimmen
| Wahlbeteiligung: | 67,22% |
|---|---|
| Stimmberechtigte: | 86.277 |
| Wähler: | 57.994 |
| Ungültige Erststimmen: | 569 |
| Gültige Erststimmen: | 57.415 |
| Ungültige Zweitstimmen: | 700 |
| Gültige Zweitstimmen: | 57.291 |
Erststimmen nach Wahlvorschlag
| Partei | Erststimmen | Prozent | |
|---|---|---|---|
| 1 | Herrmann, Joachim ( CSU ) | 23.079 | 40,20% |
| 2 | Dees, Philipp ( SPD ) | 14.243 | 24,81% |
| 4 | Bailey, Julia ( GRÜNE ) | 8.587 | 14,96% |
| 3 | Moll, Gunther ( FREIE WÄHLER ) | 3.589 | 6,25% |
| 5 | Schallock, Helmut ( FDP ) | 1.918 | 3,34% |
| 6 | Salzbrunn, Anton ( DIE LINKE ) | 1.739 | 3,03% |
| 12 | Semm, Astrid ( PIRATEN ) | 1.488 | 2,59% |
| 11 | Sommerkorn, Klaus ( DIE FRANKEN ) | 1.036 | 1,80% |
| 7 | Stadelmann, Christian ( ÖDP ) | 962 | 1,68% |
| 9 | Reeb, Marco ( NPD ) | 327 | 0,57% |
| 10 | Haskic, Beate ( BP ) | 267 | 0,47% |
| 8 | Farhad, Jan Hakim ( REP ) | 180 | 0,31% |
Zweitstimmen nach Wahlvorschlag
| Partei | Zweitstimmen | Prozent | |
|---|---|---|---|
| 1 | CSU | 21.605 | 37,71% |
| 2 | SPD | 14.499 | 25,31% |
| 4 | GRÜNE | 8.465 | 14,78% |
| 3 | FREIE WÄHLER | 3.168 | 5,53% |
| 5 | FDP | 2.911 | 5,08% |
| 6 | DIE LINKE | 2.126 | 3,71% |
| 12 | PIRATEN | 1.641 | 2,86% |
| 7 | ÖDP | 1.207 | 2,11% |
| 11 | DIE FRANKEN | 870 | 1,52% |
| 9 | NPD | 330 | 0,58% |
| 10 | BP | 259 | 0,45% |
| 8 | REP | 210 | 0,37% |
- Stand: 27.09.2013 11:02:54